What is a pFMEA? (i.e., process Failure Mode and Effect Analysis)
This article explains what a pFMEA is (i.e. Process Failure Modes and Effects Analysis) and how to use them as part of your risk management process.

I recently had someone ask for help understanding the Process Failure Mode and Effect Analysis (pFMEA) a little better. I can’t blame them, because I was lost the first time I tried to fill out a form for one. It can be confusing and overwhelming if you have never created one before.
First things first, what is a pFMEA
FMEA= Failure Modes and Effects Analysis

A lower-case letter will come before the FMEA, and that denotes the ‘what’, of what the failure is that is being analyzed. A pFMEA will often be examining process failures where a dFMEA might evaluate design failures.
Some systems capitalize all the letters. Some capitalize none. That is not what is important as long as it is consistent throughout your system. Everyone should be able to easily understand that whatever variation of pfmea is used; it means “process failure modes and effects analysis.”
What does a pFMEA do?
A pFMEA will break down your manufacturing process into its individual steps and methodically examine them for potential risks or failures. For companies that utilize our Turn-Key Quality Management System, FRM-025 process Failure Modes, and Effects Analysis can be used as a template.
For this example, we will look at receiving inspection of injection-molded casing parts for a medical device. This receiving inspection includes a manual inspection of 10 randomly selected parts out of each delivery of 100 using an optical overlay.
Process Step
This area, as the section title suggests, is the process step. When looking at the process as a whole, the pFMEA will break it down into each and every step included in that process. This area is simply that individual step that is going to be examined.
The Process Step or item function depending on what your form uses for this scenario, is going to be part of the random sampling for manual inspection of the received parts using an optical overlay. Our example is going to be the backlighting element of the optical overlay display. The backlighting element will illuminate the inspected part against the template to verify that the part is within specific dimension criteria.
Potential Failure Modes
A failure mode is a way in which that process step might fail. Since it is failure modeS, it needs to be considered that there may be more than one way for the process step to fail. Do not be fooled that because this box on the form has been filled in that the pFMEA will be complete. A thorough examination of all of the possible failures should be investigated.
Our example in this process requires the backlighting element to illuminate a visual template over the parts. The light not illuminating properly is a potential failure mode of this process.
Potential Effects of Failure
the potential effects of the failure is a look into what the ramifications would be if that failure for that process step actually happened.
In our scenario, one of the potential effects of the lighting not functioning properly is that parts outside of the designated sizing acceptance criteria may be accepted rather than rejected as non-conforming parts.
S (Severity)
The next area is the first area that requires an estimated grading of the failure. That is ‘Severity’ which is abbreviated as S. There is a scale provided in the rating section of FRM-025 that outlines the numbering system that Medical Device Academy uses.
Below is a snippet of the rating scale used, this is included with the purchase of the SYS-010 Risk Management Procedure.
| Severity (S) | ||
| Severity of the effect | Scale | Definition |
| Business Risk | 0 | No potential harm to patient or user |
| Superficial | 2 | Little potential for harm to patient or user |
In this case, our example is using molded plastic pieces of the outside casing of a medical device. Pieces that are too large or too small will not fit when making the final assembly of the device. These plastic pieces do not happen to be patient contacting, and do not affect the function of the device.
The evaluation of this failure is determined to have no potential effect on patient safety or increase any potential for risk of harm, therefore the severity is assigned as a ‘business risk’ meaning that it bears no risk for the user or the patient. This makes the Severity Score 0.
Causes of Failure
This column is exactly that. What might cause this identified failure to happen? In our example might be the light bulbs in the overlay machine may slowly burn out over time with use. This burnout causes potential failure.
If the bulb is expected to only have a lifetime of 100 hours, then the more hours the bulb is used, the dimmer the light may become. A slowly dimming light decreases the sharpness of the overlay template and our parts that are supposed to have a + or – size criteria of 10% now have a fuzzy template that in reality changes the overlay to show closer to + or – 13%. Now parts that are too small or too large may be accepted.
O (Occurrence/Probability)
This grading criterion is also found in the Rating section of FRM-025. This is how often the failure is expected to occur. How often will the lighting element of our optical overlay fail to function in the appropriate manner for this cause?
Hopefully not very often. In fact, regularly scheduled maintenance and calibration of the overlay machine could prevent this from ever happening in the best-case scenario. Our evaluations determine that the probability of this happening is low. However, since we cannot be certain it will never happen the potential for this risk exists and makes the Occurrence score a 4.
Current Process Controls
What is currently being done to control this risk? Our example uses regularly scheduled maintenance and calibration to prevent bulb burnout affecting the overlay.
D (Detectability)
Our current process is based on routine maintenance and visual inspection. This means that the bulb burnout is something that is visually inspected for and visual inspections for detectability on the rating scale are graded as 8. This chart is found in the Rating Section of FRM-025.
RPN (Risk Priority Number)
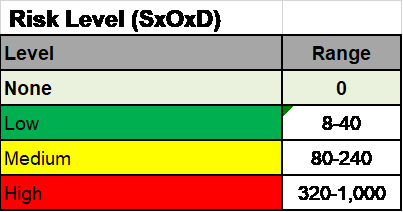
This is a number that is found by multiplying the Severity, by the Probability, by the Detectability. In our example, the numbers RPN is 0X4X8=32 for an RPN of 32 which is considered LOW.
pFMEA math
Below is a short video explaining the math behind calculating the Risk Priority Number
Recommended Actions
What if anything can be done to improve this process? In our example, a recommended action may be to transfer from visual only inspections to verification of light output by the meter. This makes the Detectability of the failure measurable by meter or gage which is a detectability score of 4.
This changes the RPN now to 0X4X4=16
The pFMEA shouldn’t be a solo thing
If it can be avoided this type of analysis should be done by a multidisciplinary team. Sometimes in smaller companies, people end up having to wear more than one hat. There are many entrepreneurs that have to function as the CEO/CFO/Design Engineer/RA/QA manager.
Ideally, a team approach should be used if feasible. Have the management level staff who have ownership of the processes participating in this analysis. They should know the process more intimately than anyone else in the company and should have more insight into the possible failure modes of the processes as they have likely seen them first hand. They are also the type of employee who would know the types of recommended actions to control the risk of those failures as well.
The pFMEA should also be a living document
As new failure modes are discovered they should be added to your pFMEA. A new failure mode might be discovered through a CAPA because the process had an actual failure that was not originally analyzed. Take an instance like that as an opportunity for improvement and to update your pFMEA as part of a living breathing risk management system. Also, use this as a time to re-brainstorm potentially similar failure modes that may not have been considered previously so that they can be controlled before they happen.
If you took the time to watch the video above it is also mentioned that in some instances the very first FMEA must be based on estimates because there is no data. Managers and engineers may be forced to estimate the probability of occurrence. If that is the case the FMEA should be updated in the future to adjust the (O) score to reflect what is occurring in actuality based on real data and not the theoretical data that was used for the initial estimate.
What is a pFMEA? (i.e., process Failure Mode and Effect Analysis) Read More »


