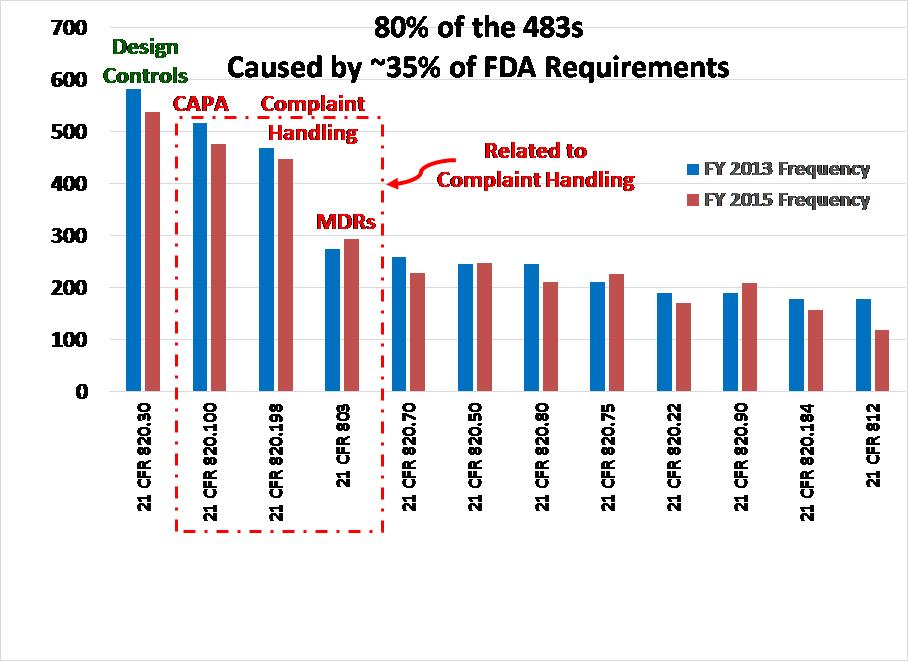
This article presents a Pareto Analysis of FDA 483 inspection observations from FY 2015. It compares the trends observed with a similar Pareto analysis that was performed a couple of years ago on FY 2013 data.
Method of Data Analysis for FDA 483 Inspection Observations
The FDA posts Excel spreadsheets on the website to download data for FDA 483 Inspection Observations. These spreadsheets include inspection results for all the divisions of the FDA. To perform data analysis for FY 2015 results, I deleted the sheets that were not specific to medical device manufacturer inspections (i.e., only used data from CDRH). I sorted the data by the regulation that was referenced. For example, all the sub-clauses for 21 CFR 803 were combined into one category for the Pareto analysis. The combined categories were then sorted from the most frequent 483 inspection observations to the least frequent 483 inspection observations. The data was then added to the graph that I produced in February 2014 using FY 2013 results as a second data set. The resulting graph is shown above.
Comparison of FDA 483 Inspection Observations between FY 2013 and FY 2015
For MDR Compliance (i.e., 21 CFR 803), there was a slight increase in the number of 483 observations issued from FY 2013 to FY 2015. However, the difference was only a 1% increase from 6.2% to 7.2% of the total number of 483s issued. There was an even smaller increase in the number of findings related to purchasing controls (i.e., 5.6% increased to 6.1%). I noticed a slight drop in the number of findings related to design controls, CAPA, and complaint handling. However, the overall trend for FY 2013 and FY 2015 is essentially the same.
There are two other categories where an increase was observed: 1) process validation increased by 0.7% from 4.8% to 5.5%, and 2) control of nonconforming product increased 0.8% from 4.3% to 5.1%. These areas are important. Control of nonconforming product is one of the major sources of CAPAs and often results in design changes. Therefore, FDA inspectors are reviewing your data for a nonconforming product during inspections to help them identify potential CAPAs and design changes that may have been made. The typical sequence is 1) nonconformity, 2) investigate nonconformity as part of a CAPA, and 3) initiate a design change as a corrective action.
Process validation is a completely different area that is separate from CAPA, complaint handling, and MDRs. However, inadequate process validation is a common root cause of nonconformities. Therefore, inspectors often follow an audit trail from a nonconforming product record back to a process change that was implemented but inadequately validated. Thus, an increased focus on nonconformities may be the reason for an increase in FDA 483 inspection observations related to process validation.
So what’s the big deal?
This proves that the FDA inspectors continue to be predictable. The “playbook” for FDA inspections is the QSIT Manual. It hasn’t changed since 1996. Yet, companies continue to be shocked and amazed by FDA inspectors.
Additional Resources
If you want to learn how to prepare for FDA inspections, I recorded a webinar you can download (FREE). I recorded the webinar in May of 2014, but it’s been a couple of years, and I’ve learned a few new tricks. Therefore, I’m going to re-record the webinar and update it for lessons learned. I’ll even share a few tools and approaches to avoid findings and reduce the risk of warning letters. I’m also evaluating a new application that is designed for teams to have private chats and file sharing during an inspection. Stay tuned to my webinars page, and I’ll post that webinar soon. Maybe I’ll record something from Germany next month.
Until then, I am working on a webinar specific to medical device reporting. Many companies have still not updated their MDR procedures to reflect the eMDR process using electronic submissions gateways. Therefore, I’m releasing an updated procedure for MDRs, and I am offering a webinar bundle to train people on how to comply with 21 CFR 803 and the procedure. You might also be interested in my previous webinar specific to control of the nonconforming product.


Pingback: Root cause analysis - Learn 4 tools - Medical Device Academy Medical Device Academy
Pingback: Quality objectives for achieving your goals - Medical Device Academy Medical Device Academy
Pingback: CAPA - Corrective/Preventative Action Medical Device Academy