Root cause analysis – Learn 4 tools
The author describes four tools (Five Why Analysis, Is/Is Not Analysis, Fishbone Diagram, and Pareto Analysis) and how each one can help conduct effective root cause analysis.
Quality problems are like weeds. If you don’t pull them out by the root, they grow right back.
Training on the 4 Tools
Most companies are doomed to repeat their mistakes because the root cause of their mistakes is not fixed. Why don’t companies fix their mistakes? Because the people responsible for the corrective actions (CAPA), were not adequately trained on root cause analysis. Adequate training on root cause analysis requires three things:
- Courage to admit that your process is broken
- Learning more than one tool for analyzing problems
- Practicing the use of root cause analysis tools
If your auditor identifies a nonconformity and you disagree with the finding, then you should not accept the finding and state your case. If an inspector rejects a part, and you believe the part is acceptable, then you should allow the part to be used “as is.” In both of these cases, however, you need to be very careful. Sometimes the problem is that “acceptable” is not as well-defined as we thought. I recommend pausing a moment and reflecting on what your auditors and inspectors are saying and doing. You may realize that you caused the problem.
Once you have accepted that there is a problem, you need to learn how to analyze the problem. There are five root cause analysis tools that I recommend:
Root Cause Analysis Tool # 1 – 5 Why Analysis
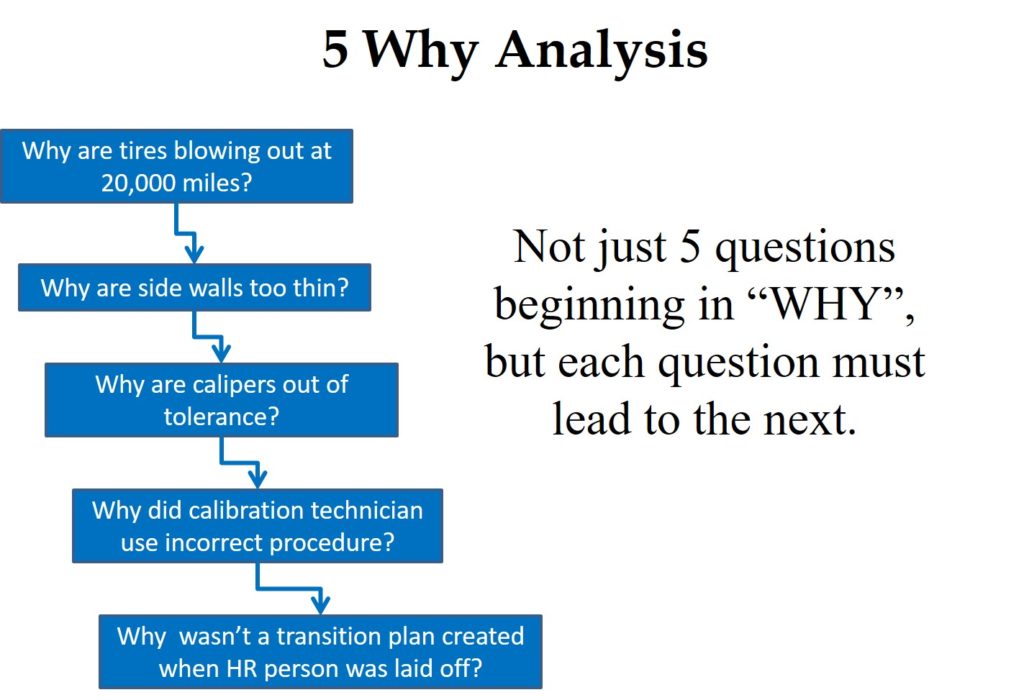
A “Five Why Analysis” is not just five questions that begin with the word “why.” Taiichi Ohno is credited with institutionalizing the “Five Why Analysis” at Toyota as a tool to drill down to the root cause of a problem by asking why five times. I have read about this, used this tool, and taught this concept to students, but I learned of a critical instruction that I was missing when I read Toyota Under Fire.
In that book, Jeff Liker makes the following statement, “Toyota Business Practices dictates using the ‘Five Whys’ to get to the root cause of a problem, not the ‘Five Whos’ to find a fire the guilty party.” At the end of the book, there are lessons learned from Toyota’s experience. Lesson 2 says, “There is no value to the Five Whys if you stop when you find a problem that is outside of your control.” If your company is going to use this tool, it is important that the responsible person is the one performing the five why analysis, and asks why they didn’t take into account forces that are out of their control.
Root Cause Analysis Tool # 2 – Is/Is Not Analysis
The next tool was presented to me at an AAMI course that I attended on CAPA. One of the instructors was from Pathwise, and he explained the “Pathwise Process” to us for problem-solving. A few years later, I learned that this tool is called the “Is/Is Not Analysis.” This tool is intended to be used when you are having trouble identifying the source of a problem. This method involves asking where the problem is occurring as a potential clue to the reason for the problem. For example, if the problem only occurs on one machine, you can rule out a lot of possible factors and focus on the few that are machine-specific.
The reverse approach is also used to help identify the cause. You can ask where the problem is not occurring. This approach may also lead you to possible solutions to your problem. For example, if the problem never occurs on the first or second shift, you should focus on the processes and the people that work on the third shift to locate the cause. The “Is/Is Not Analysis” is seldom used alone, but it may be the first step toward locating the cause of a quality problem.
Root Cause Analysis Tool # 3 – Fishbone Diagram
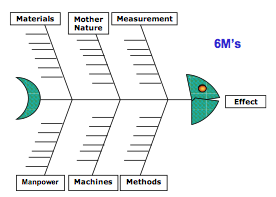
This name comes from the shape of the diagram. Other names for this diagram are the “Cause and Effect” or “Ishikawa” diagram. If a problem is occurring in low frequency and has always existed, this might not be your first tool. However, I typically start with this tool when I am doing an investigation of nonconforming product—especially when rejects suddenly appear.
If you are baffled about the cause of a problem, brainstorming the possible causes in a group sometimes works. However, I like to organize and categorize the ideas from a brainstorming session into the “6Ms” of the Fishbone Diagram.
Root Cause Analysis Tool # 4 – Pareto Analysis
The fourth root cause analysis tool is the Pareto Analysis named after Antoine Pareto. This tool is also a philosophy that was the subject of a book called The 80/20 Principle: The Secret to Achieving More with Less. The Pareto Analysis is used to organize a large number of nonconformities and prioritize the quality problems based upon the frequency of occurrence. The Pareto Chart presents each challenge in descending order from the highest rate to the lowest frequency. After you perform your Pareto Analysis, you should open a CAPA for the #1 problem, and then open a CAPA for the #2 problem. If you get to #3, consider yourself lucky to have the time and resources for it. We have an example of a Pareto Chart in our article on FDA 483 inspection observations from 2013.
Additional Training Resources
If you are interested in learning more about root cause analysis and practicing these techniques, please register for the Medical Device Academy’s Risk-Based CAPA training.
Root cause analysis – Learn 4 tools Read More »


