Inspection Results: Understanding FDA Requirements
Learn three valuable tips for efficiently recording your inspection results in medical device manufacturing while remaining FDA-compliant.
What are the best ways to record inspection results?
If you are inspecting a lot of material at an incoming inspection, and the inspection plan calls for inspecting ten samples for length, what is the best way to record the inspection results?
The person who sent me this question also provided three options (read on for better suggestions):
- Record the maximum and minimum dimensions
- Record all ten measurements in a data collection table
- Circle “pass” or “fail” next to each sample number
FDA requirements for incoming inspection results
The first method fails to meet the requirement as specified in 21 CFR 820.80(b) because recording only the maximum and minimum dimensions of the ten samples does not include the inspection results for the eight samples in between the extremes. The second method meets the requirements, but this method takes the most amount of time. The third method appears to meet the requirements. However, if you read the FDA requirements more carefully, 21 CFR 802.80(e)(3) states that “[Inspection] records shall include…the results.” If the test method is pass/fail, circling pass or fail makes sense, but if the test measures a dimension, the result should be a measurement. Also, if you have to investigate a complaint or non-conforming product, this dimensional information might be critical to the analysis.

The FDA has provided an official interpretation of these requirements in the QSR preamble:
“Comment # 147: One comment stated that record keeping this dimensional information might be critical to the analysis if you have to investigate a complaint or non-conforming product is a significant cost factor in the operation of a total quality system and that the revised CGMP regulation should not add cost through duplication of documentation. The comment said recording all quantitative data is inappropriate and of little value.
FDA agrees that unnecessary duplication of documentation should be avoided. They also believe that the Quality System Regulation requires the minimum documentation necessary to ensure that safe and effective devices are designed and produced. FDA similarly believes that maintaining records of results of acceptance activities is imperative to ensure that non-conforming product is not inadvertently used or distributed. FDA has, however, deleted from Sec. 820.80(a) the requirement for recording the results of inspections and testing, because Sec. 820.80(e) requires that the results of acceptance activities be recorded. The requirement in Sec. 820.80(a) was, therefore, unnecessary. Further, the regulation does not specify quantitative data, but simply requires that the results be recorded.
The FDA believes that it is essential for the manufacturer to maintain records which provide evidence that required acceptance activities were completed. These records must clearly show whether the product has passed or failed the acceptance activities according to the defined acceptance criteria. If a product fails to pass acceptance activities, you must identify the product as a non-conforming product and conduct an investigation. If the acceptance records are not clear about how the product failed, then the manufacturer may end up duplicating the acceptance to perform appropriate investigations.”
Here are three other methods that can save you time and add value.
Method 1: Run Charts
If you create an inspection results form that is in the form of a “Run Chart,” then you can put an “X” on the appropriate location of the Run Chart for each sample (see Chart 1 below). It is less time-consuming to write an “X” than the actual value. However, if you need to conduct an investigation, you can convert the “X” into a quantitative number and enter the values into a spreadsheet or statistical analysis software (e.g., Minitab). Also, inspectors and supervisors can visually glance at a Run Chart and determine if the measurement is “in control” or “out of control.” This is done by marking the upper and lower specifications on the Run Chart. Over time, alert limits can be established as a preventive action, as well. You can also use this data as a rationale for eliminating certain inspections, reducing sampling, qualifying suppliers, and even converting a part from statistical sampling to a “dock-to-stock” inspection.
One disadvantage of Method 1 is that it takes time to create inspection forms, and the forms need to be maintained as a controlled document, with the drawings for each part–as paper records or electronically. Therefore, I recommend that companies create a quality plan that calls for creating one of these charts every time an NCR is initiated for a part. That way, you only are creating this type of chart for parts that are found to be out of specification. This approach allows you to implement the work over a reasonable period of time. You can also habitually review historical data when you have an NCR that does not already have a Run Chart created.
Method 2: Automating Inspection Results
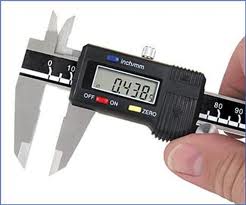
If you have critical inspection activities and a high volume of parts to inspect, you can automate recording measurements and performing data analysis. This can be done by purchasing digital inspection devices that automatically send the values to a computer system. Devices with this capability only require pressing a button to record the value, and the computer system will often provide the inspector with the sampling plan for each lot automatically. These sophisticated software systems require validation, giving manufacturers extensive real-time data on supplier performance, in-process inspection, and final product acceptance. The primary disadvantage of this method is the cost of installation and set-up.
Method 3: Pass/Fail with Go/No-Go Gauges
If a supplier can make good parts with high certainty, you may not need routine monitoring of part dimensions. In this case, you can reduce your inspection time by using a “go/no-go” gauge for critical attributes instead of measuring the dimensions. This type of gauge would be ideal if the tolerance for a part with a tolerance of +/- 3 mm. The length of a part can be verified to be between two lines, representing the upper and lower specifications for the tolerance. This method can also be used for precise tolerance if magnification is used. Still, performing a gauge R&R study of any go. If this type of inspection is used, you can use an inspection record that only records pass/fail. However, this inspection method is not recommended for parts that are occasionally out of conformity because re-measurement of parts will be necessary to investigate non-conforming products.
Statistical Techniques
The most significant advantage of methods one and two is that they facilitate statistical data analysis. Chart one shows too much variation for the tolerance of 6.50 mm to 6.60 mm. Some companies qualify suppliers for a new part by establishing a threshold for a minimum Cpk value (i.e., process capability coefficient). A typical Cpk minimum is 1.33. Often, the company will require that suppliers provide data for 100% inspection of the initial production lot. This data is then used to create a sampling plan based on the likelihood of parts being out-of-specification. High-risk dimensions might require 99.5% confidence, medium-risk dimensions might require 99% confidence, and lower-risk dimensions might require 95% confidence. Each confidence level corresponds to a different Cpk value. It is not possible to do this type of analysis for Method 3.
Inspection Results: Understanding FDA Requirements Read More »


