This article explains why three is never the right answer, and this article explains why asking how many minimum data points are needed to identify a trend is the wrong question.
Recently a client sent me an email asking the same question about data analysis in two different ways. The first question asked, “How many of the same situation need to occur before it is considered a trend?” The second question asked, “How many nonconformities can occur before a CAPA should be opened?” This question can be asked a hundred different ways, but it’s the wrong question.
Minimum Data Points for Variable Data
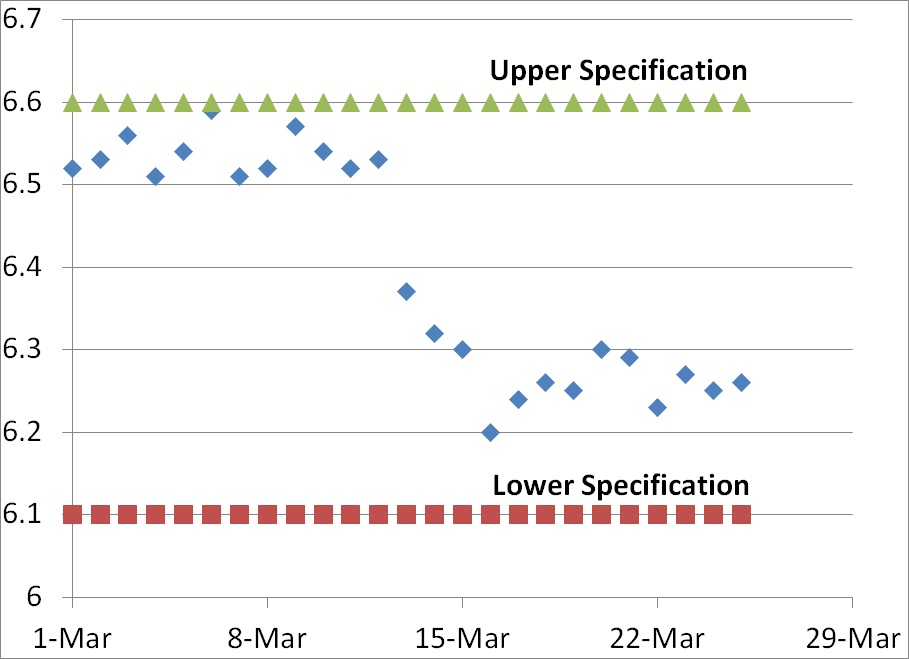
In the graph above we have variable data rather than attribute data. When you have variable data, the answer regarding the number of minimum data points is always a quantitative answer that is objective rather than subjective. Typically the new data point lies outside of the upper or lower specification for the element being measured (i.e., >6.6 or <6.1 in the graph above). Even if the new data point remains within specifications, a CAPA may still be issued if the new data indicates that there has been a shift in the normal distribution of data.
In our graph above, on March 13 the newest data point was 6.37. Although this value is within specifications, in fact close to the center of the range, this value represented a shift in the trend that exceeded the normal distribution of data observed for the previous 12 days of the month. The mean for the first 12 days was 6.54 and the standard deviation was 0.0250. Many people establish alert limits that equal mean +/- 2x standard deviation (i.e., 6.59 and 6.49) and the action limit is often set equal to the mean +/- 3x standard deviation (i.e., 6.62 and 6.47). Therefore, a value of 6.37 is well outside the normal distribution for the first 12 days of the month–but not outside specifications.
The shift in data values for this graph indicates a shift, but the process was capable of remaining within specifications before the shift and process capability actually appears to be slightly better after the shift. In this case, there is no need for a CAPA but if the reason for the shift is unknown an investigation would be recommended. However, if different lower specification were chosen (e.g., 6.4) then the new data point on March 13 would be outside the specification and product would be identified as nonconforming.
Nonconforming results should always trigger in an investigation?
If the process was validated and the mean +/- 2x standard deviations remains within the specifications, then greater than 95% of the product should be conforming. If the the mean +/- 3x standard deviations remains within the specifications, then greater than 99.5% of the product should be conforming. Therefore, based upon the data from the first 12 days of March any data points that are lower than 6.47 should be very rare unless there is a process shift.
An investigation of the data point on March 13 should result in a CAPA unless the outlying data can be explained and a new trend with a lower mean is expected. If the new data point cannot be explained, then only one new data point is needed and the data does not even need to be nonconforming. If no actions are taken the drop in the measured value could continue and nonconforming product could result, while any action taken on March 13 is a preventive action.
Minimum Data Points for Attribute Data
In the case of the first question, the negative customer situation that is reported to a company may be an attribute rather than variable data. For example, “customer unsubscribed” after an email blast went out is a negative customer situation. If you know the % of customers that unsubscribed when email blasts go out, then you have variable data. If you only know that one person unsubscribed, then you only have an attribute (i.e., unsubscribed instead of continued subscription). The first time an unsubscription occurs, you should do an investigation to see if there is an issue other than frequent email blasts that exceed a customer’s expectations in frequency. The action taken could be to establish an alert and action limit for unsubscribed emails based upon industry norms or the % calculated from the first event.
What are the right questions?
Instead of asking how many minimum data points are needed to initiate a CAPA, we should make sure we are measuring the right variables. The % of unsubscribed is a valuable variable data point, but knowing that one person unsubscribed without knowing how many people received that email blast is not nearly as helpful in making future decisions. Another question is to ask, “Why did the person unsubscribe?” If the reason is unknown, you may want to contact the former subscriber and ask them–but probably not by email. If you have a theory why people are unsubscribing you can also perform an experiment to test your hypothesis. If you think the cause is that emails are being sent too frequently, then you can split your list and send the same emails to two halves of a list at different frequencies. If you are correct, then the list that has more frequent emails should also have a higher % of unsubscribers. This type of design of experiment (DOE) is one of the root cause investigation tools I recommend in my Risk-Based CAPA webinar.
Recommendations for Trend Analysis
Whenever you establish a new metric or quality objective, you should also establish a limit for when you intend to investigate and when you intend to take preventive or corrective actions. If you simply start measuring a variable or attribute, you may have difficulty recommending actions to management during your next management review and explaining why actions were not taken during an FDA inspection or an audit.


Pingback: Disposition of Nonconforming Materials-21 CFR 820.90 Compliance - Medical Device Academy Medical Device Academy